AsTher Thermodynamic Database and Applications
Examples
1.9.4. Enthalpy-Concentration,
Liquid-Gas-Concentration-Diagrams of Ethanol-Water
Mixtures
(see also example
calculations using AsTher Process Calculator for MS Excel )
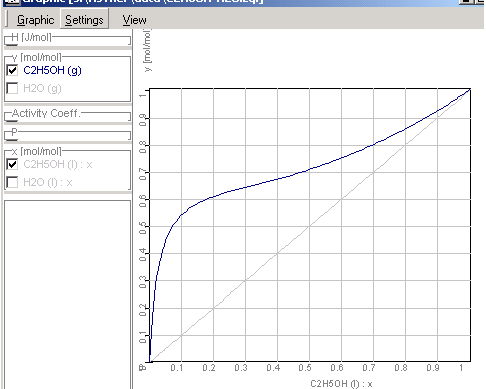
This example explains, how you can plot state
diagrams (e.g. xy-diagrams as following picture) using the empirical
equations of activity
coefficients in the application Equilibrium.
There is x the concentration in liquid- and y in the
gas phases.
1.9.4.1. Elements
Main Menu: System -> Elements.
Selection: C,H,O
1.9.4.2. Compounds
In the window for Gas, Select Compounds
C2H5OH(g) and H2O(g)
In the window for Liquid, Select Compounds C2H5OH(l) and H2O(l)
1.9.4.3. Activity
Coefficients
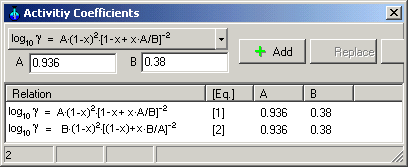
Main Menu: System -> Activity
Coefficients
Select the logarithmic equations of van
Laar in drop-down button as
shown in the following picture.
Enter coefficients A and B, press Button Add
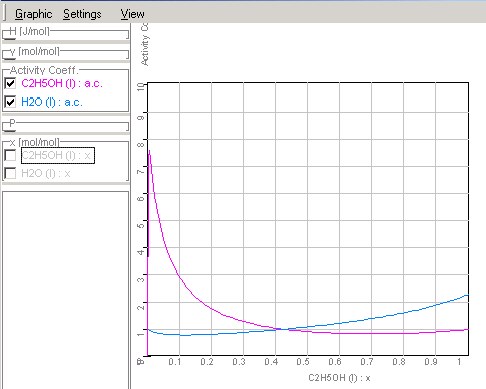
Equation 1 is the activity
coefficients of ethanol and Equation 2 is the
activity coefficient of water in binary mixtures of liquids at 50°C
corresponding van Laar
(the constants A and B are given by C.A. Jones, A.P.
Schoenborn, Ind. Chem. Eng. 40 (1940) 1273-1276).
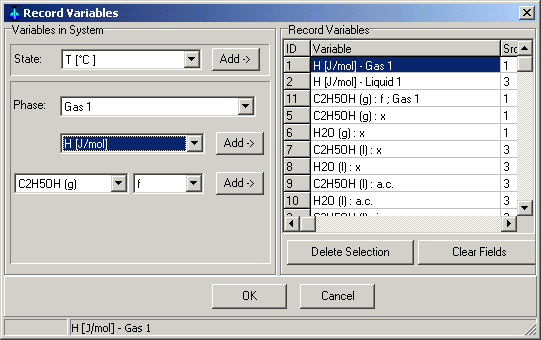
1.9.4.4. Record Variables
Main Menu: Monitoring -> Record
Definition
Select the concentration of the ethanol and water in liquid and gas
phase. You can select also other variables to record
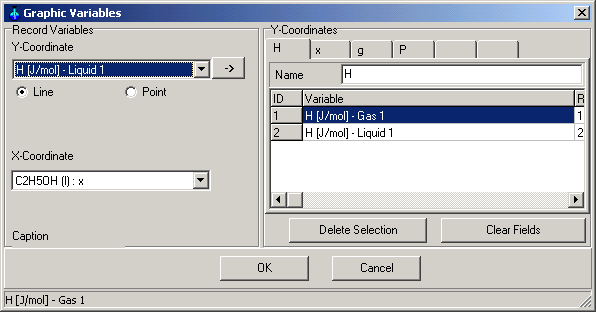
1.9.4.5. Graphic Variables
Main Menu: Monitoring -> Graphic
Variables
You can determine, which variables are in which coordinates to show in
the Graphic Window.
1.9.4.6. Assignment of the
Equations for Activity
Coefficients to Substances Ethanol and Water
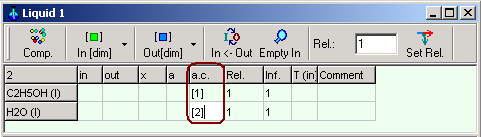
Enter for activity coefficient of ethanol [1] , and for activity
coefficient water [2] in the
columns a.c. in the phase
table corresponding the definition of the
equations for activity coefficients in Chapter 1.9.4.3.
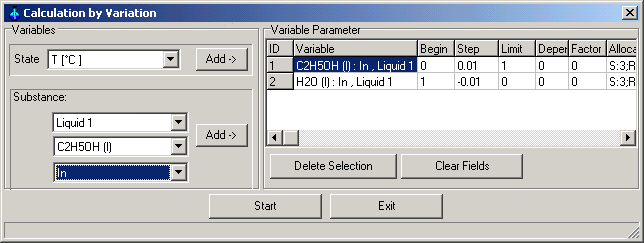
1.9.4.7. Calculation
Main Menu: System -> Calculation
by Variation
Insert as variables :
Input Liquid 1 C2H5OH (l) from 0 to 1 with steps +0.01
Input Liquid 1 H2O (l) from 1 to 0 with steps -0.01
Start the calculations.
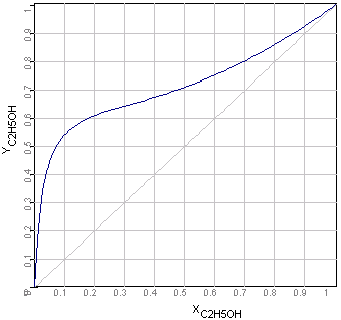
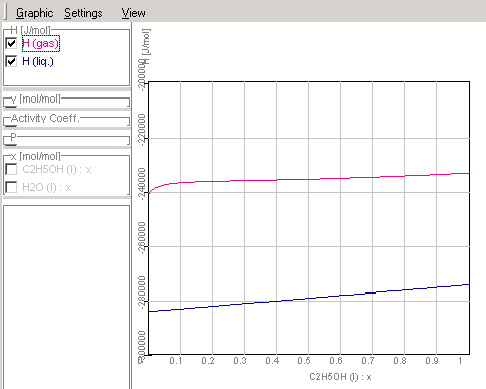
1.9.4.8. The results of the
calculations will be shown in Graphic Window
Enthalpy-concentration diagram of
ethanol-water-mixtures
xy-Diagram Ethanol-Water Mixtures
Course of the activity coefficients in
ethanol-water mixtures corresponding given data in Chapter
1.9.4.3.